WordPress Studio, a local development environment, has introduced two new Debugging features designed to streamline the process of identifying and resolving issues in WordPress projects. The platform now offers integrated support for the Xdebug PHP extension and provides simplified access to debug logs. These additions aim to replace more manual methods like using var_dump() or scanning error log files, offering developers more efficient tools for troubleshooting code within their local setups.
The features are available to all WordPress Studio users immediately. They are built on the WebAssembly version of PHP that powers WordPress Playground, which means no additional system-level installation or configuration is required from the developer.
Step-Through Debugging with Xdebug
Xdebug is a widely used PHP debugging extension that allows for interactive debugging. Developers can set breakpoints in their code, step through execution line by line, and inspect variable states in real time directly from their integrated development environment, or IDE. This approach provides a more controlled and insightful method for investigating problems compared to outputting static debug information.
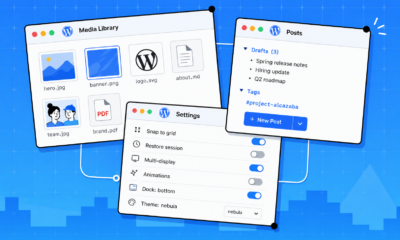
Within WordPress Studio, enabling Xdebug is managed through the site settings interface. Users select a site, navigate to the Settings and then Debugging tab, and check the “Enable Xdebug” option. The site restarts automatically with the debugger active. A bug icon appears in the sidebar for the site where Xdebug is currently enabled.
Studio documentation notes that Xdebug can only be active on one site at a time within the environment. To debug a different site, the feature must be disabled on the current one first. The documentation also states that enabling Xdebug will result in noticeable performance slowdowns, recommending it be turned on only during active debugging sessions.
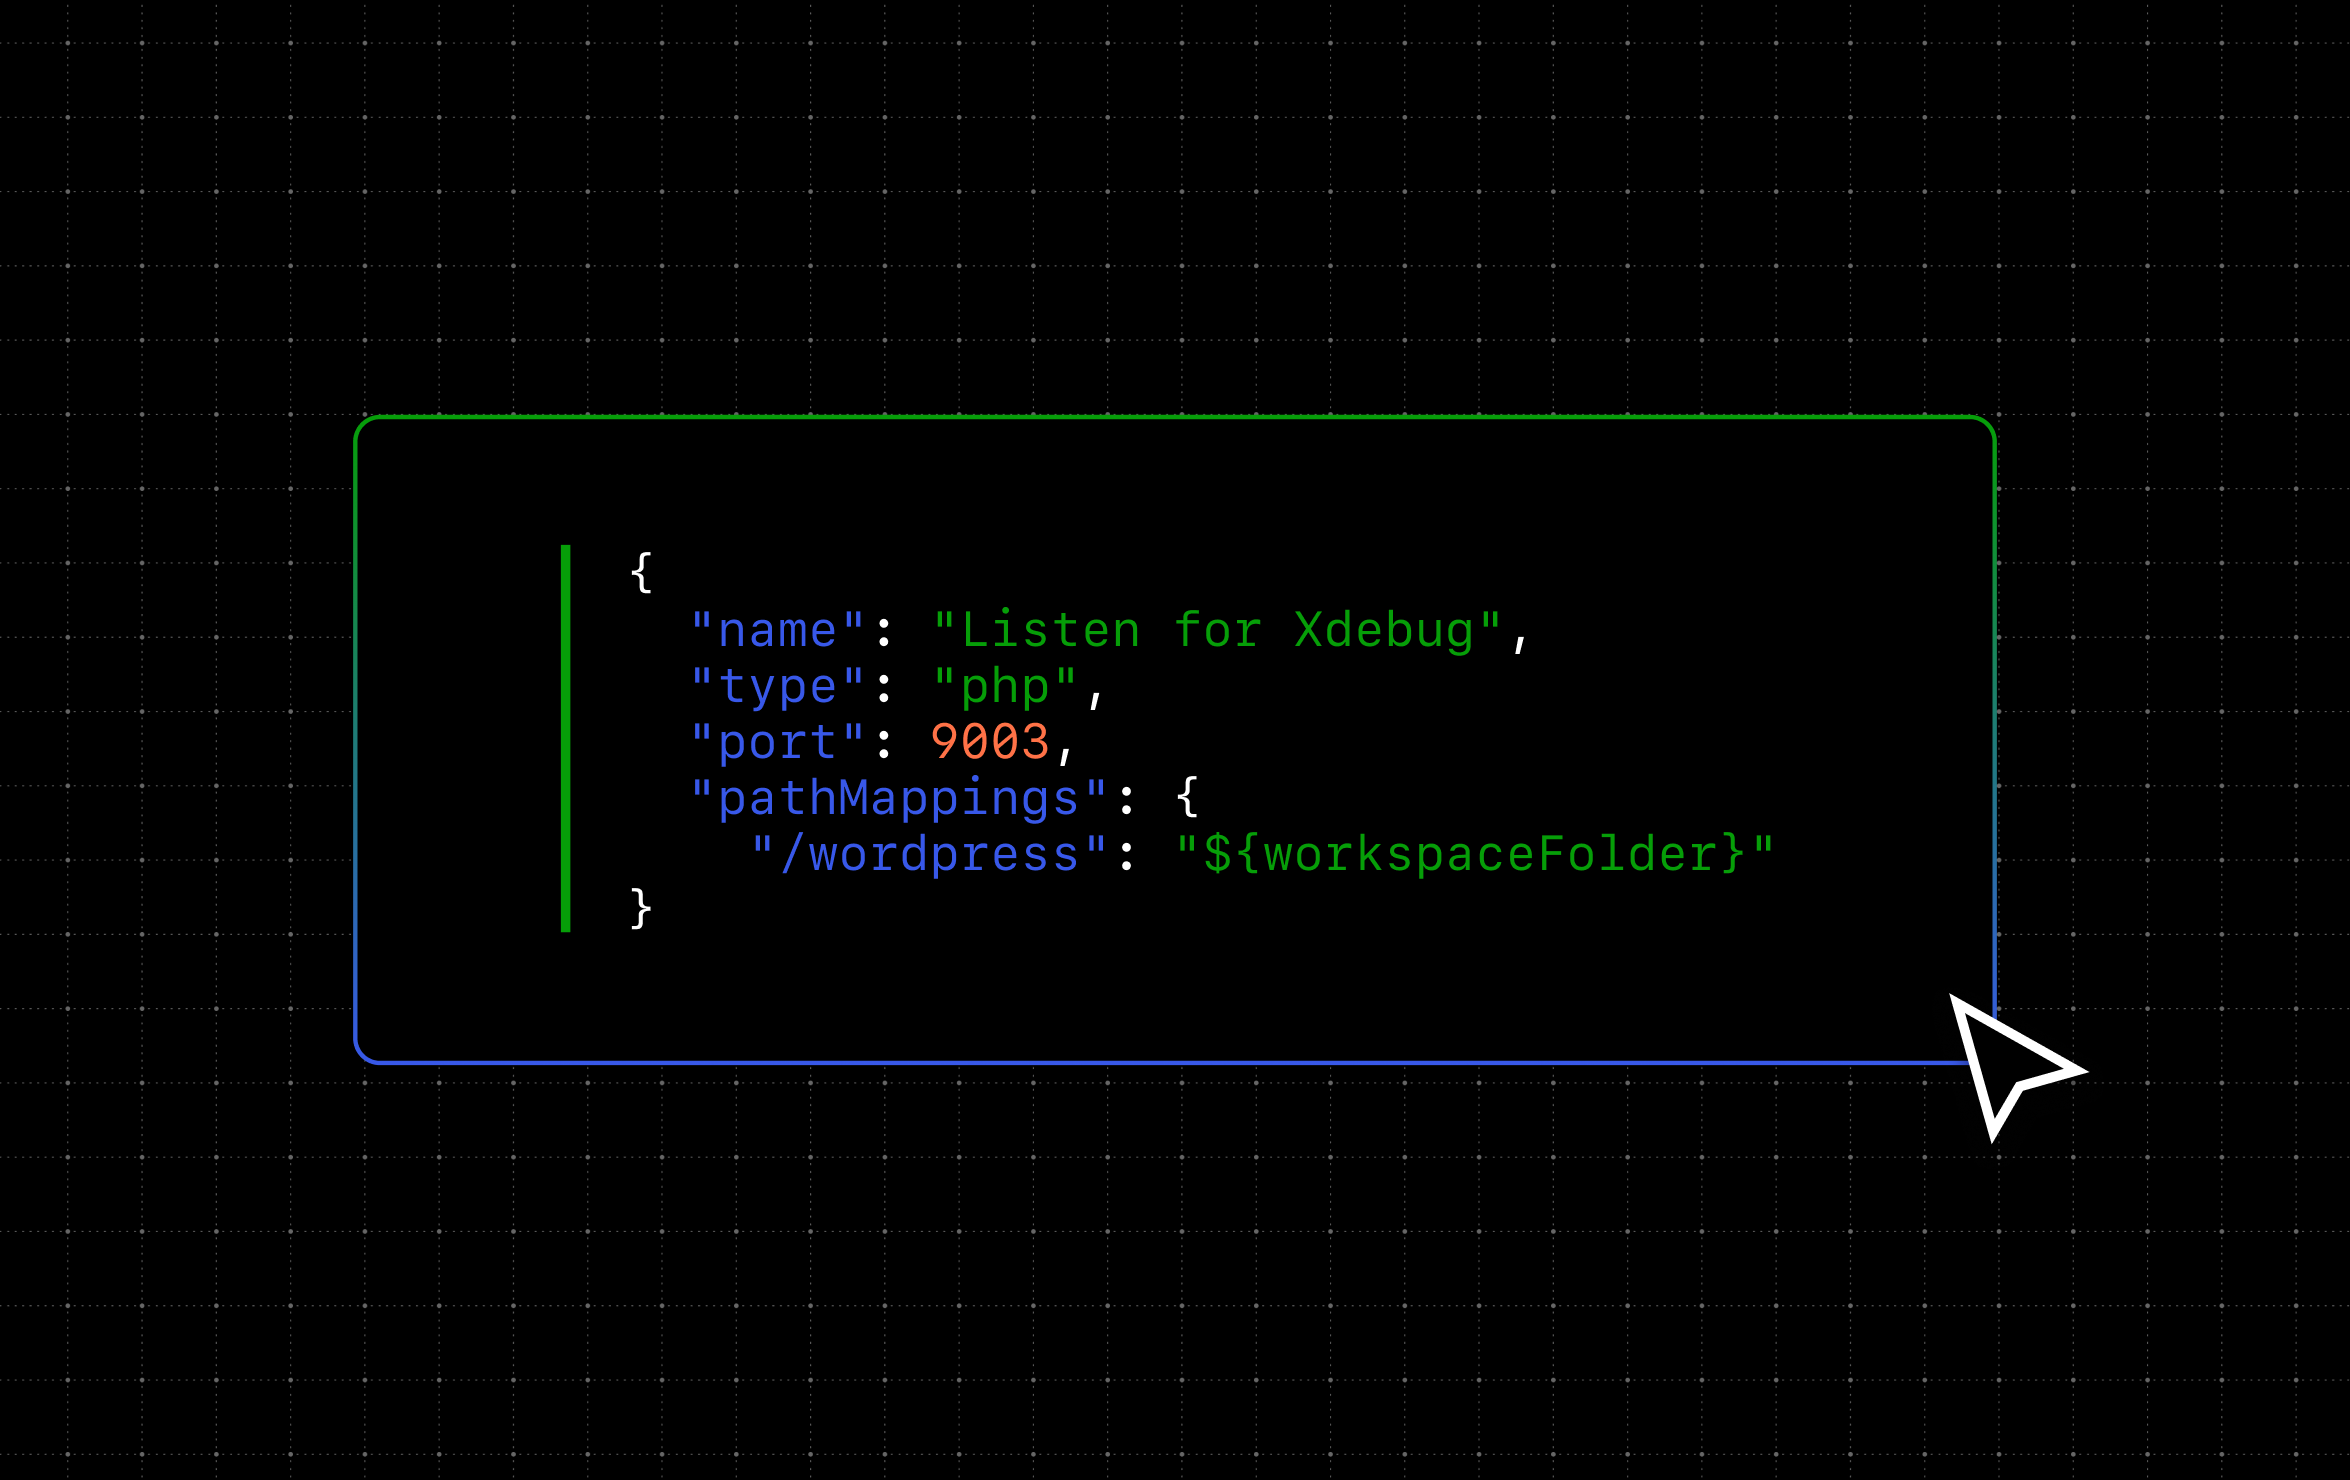
Connecting an IDE
Once Xdebug is enabled in Studio, developers can connect their preferred code editor or IDE to begin a debugging session. The Studio environment listens for debug connections on port 9003. Official documentation provides a full setup guide for integrating various development environments.
Streamlined Debug Log Access
For scenarios not requiring a full interactive debugger, WordPress Studio has added a dedicated toggle for WordPress debug logs. This feature automatically configures the WP_DEBUG and WP_DEBUG_LOG constants for the selected site.
Enabling the log is done through the same Debugging tab in site settings. When activated, PHP errors, warnings, and notices are written to a file at wp-content/debug.log within the local site. A direct link to open this log file appears in the Studio interface, removing the need to manually locate the file path.
Developers can also write custom messages to this log using PHP’s standard error_log() function, which can be useful for tracking variable states or execution flow during specific events like plugin activation or API requests.
Browser Error Display
A separate toggle within the Debugging settings controls the WP_DEBUG_DISPLAY constant. When “Show errors in browser” is enabled, PHP errors are printed directly into the HTML output of the page, making them immediately visible during development. The platform advises that this setting is best used alongside the debug log, not as a replacement, and should remain disabled on any site accessible to clients or the public to avoid exposing sensitive path information.
Impact on Development Workflows
The introduction of these tools addresses different aspects of the local development debugging process. The debug log functionality offers a lightweight method for continuous error monitoring. The Xdebug integration provides a deeper, interactive tool for complex problem-solving where stepping through code execution is necessary.
By incorporating these capabilities, WordPress Studio positions itself as a more comprehensive local development environment for building and troubleshooting WordPress websites. The features are presented as a way to reduce the time developers spend identifying the root causes of bugs in themes, plugins, or core code.
The ongoing development of local environment tools reflects a broader industry trend towards integrating professional-grade debugging directly into development platforms, lowering the barrier to entry for sophisticated troubleshooting techniques.